Over the weekend I started building an interface for an Arduino to monitor my heating system as part of the whole house energy monitoring project. I happen to have a rather strange heating system. The house was built using all electric heat. Over the years it was remodeled to be baseboard hot water in the basement, high velocity forced air using a boiler on the first floor (along with a pellet stove), and it remains electric on the second. My immediate interest is just to monitor when the three hot water zones called for heat and when the furnace actually was running. Later I want to add the pellet stove and A/C during the summer. The electric heat on the second floor will be monitored from the circuit panel.The boiler control system runs on 28VAC. The basic circuit (one for each zone valve) consists of a transformer that runs through the thermostat (a basic switch) and then to the zone valve and back to the transformer. The zone valve is implemented as a simple heater coil. As it heats up, it melts a wax that shrinks in volume allowing a piston to move and open up the water flow.
Once the valve opens (takes about 30 seconds), a switch in the zone valve closes that is used to signal the furnace that heat is needed as well as to kick on the pump. This circuit uses its own 28VAC transformer and included multiple safety interlocks. Monitoring this circuit I will leave to another day. My first job is to monitor the thermostats.
The first problem is that the furnace control circuits run on 28V alternating current so not only do I need to do level converting from 28 down to the 5V Arduino, but also I need to isolate the power. When I hear the word isolation my mind jumps to optical isolation. The market is full of optoisolators of various sizes, shapes, and capabilities. The basics of an optoisolator is an LED that shines on a phototransistor inside the part. The two sides are electrically separated giving often thousands of volts of isolation.
To use an optoisolator you simply need to power the LED side as if it were a simple LED. From the spec sheet you get the voltage drop across the part and the current range needed to activate the output. These values are normally about 1.3V and 20ma. So how to get those types of values from 28VAC and a circuit that draws 1.1 amps?
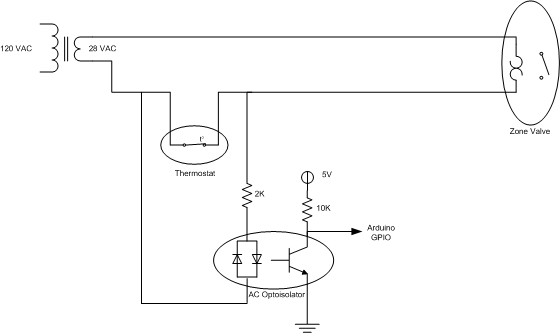
My solution was to simply put a resistor and the LED across the thermostat switch. When the thermostat was not calling for heat, the 28VAC shows up across the switch. I sized a resistor at 2K resistor to provided 14ma (28/2000) of current. Next I looked at the power and determined the resistor would consume 0.392 watts (0.014*28). So I purchased some 1W 1K metal oxide film resistors.
When installed, the circuit (see diagram at end of post) worked perfectly. When the thermostat called for heat, the LED part of the optoisolator was short circuited, and the output was disabled. When not calling for heat, the LED drew about 12ma and the output was enabled. Having those 12ma amps run through the circuit does cause the heater coil in the zone valve to warm up, but not nearly enough to cause the wax to melt and the valve to open. Even with the full 1 amp of current, the zone valve still takes a few minutes to activate.
So now I have on order a prototype Arduino shield and a bunch of JST connectors to start to implement the monitor. I plan to put the optoisolators and the various resistors on the prototype shield and feed the outputs to the digital inputs. I also plan to put two thermistors on the board as well. One to measure the outdoor temperature and the other an indoor temperature. The Arduino will then monitor the zones and temperature and compose an RS-232 message every few minutes. That message will be picked up by my Linux file server that will analyze the data.

what is the processor of this project?
The processor is an Arduino that monitors the various heating and cooling zones. It also records the indoor and outdoor temperature. The data is then posted using an ESP8266 wifi chip to my file server via my home router. The file server runs an application that collects the data, logs it to a CSV file and once a day plots its and sends it do me as an email.